
用AI大模型分析个人财务数据,免费、无需联网且保护数据隐私
2024年上半年刚过,很多人开始盘算自己的财务状况,想削减开支、制定更合理的理财计划。但直接拿ChatGPT这类工具来处理个人财务数据,隐私风险实在太大——谁也不愿意把自己的银&行流水、消费记录上传到云端吧。于是,一个完全在本地运行的AI财务分析助手应运而生:它无需联网、完全免费,数据始终留在你自己的电脑上。
这个本地AI助手会先导入财务数据,接着分析收入和支出,最后根据你的生活目标给出个性化的财务规划。下面,就一步步演示如何从零搭建这样一个工具。
免责声明:本文仅用于学习,不作为个人财务、投资建议。
整体介绍
目标及架构
整个应用使用Streamlit搭建用户界面,核心逻辑则依赖LangChain与Ollama中的本地开源大模型。项目中用到了Mistral和LLA VA这类前沿开源模型,来实现多模态功能——比如直接看懂图表。
通过精心设计的提示词,大模型被设定为一个“专业财务规划师”。项目的具体目标包括:处理和分类财务数据;分析总收入、支出和结余,同时可视化收入与支出的变化趋势;利用多模态能力理解图表,发现财务规律;最后,根据用户的生活方式生成个性化的投资建议。
需要的工具
Ollama
LangChain
Streamlit
Step1:安装应用和准备财务数据
安装Ollama
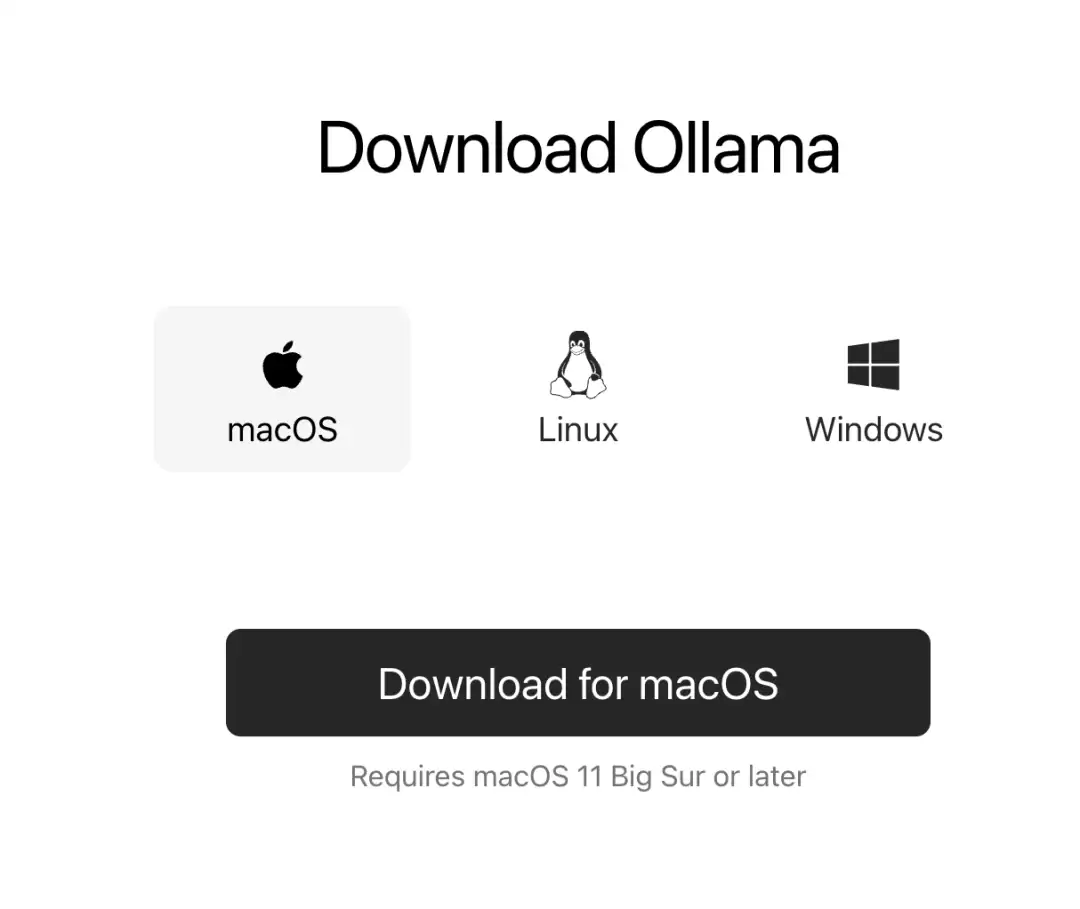
访问Ollama下载页面,选择与你的操作系统匹配的版本,下载并安装。
安装后,打开终端(Mac用户搜索“终端”,Windows用户搜索“cmd”),输入以下命令。这些命令会把开源大模型下载到你的电脑上。本项目需要Mistral和LLA VA。
ollama serve
ollama pull mistral
ollama pull lla va
ollama run mistral
ollama run lla va
准备数据集
这里用合成数据代替真实财务数据。用ChatGPT生成了1000笔财务记录,你也可以直接使用自己的真实数据。生成测试数据的提示词如下:
生成一个年轻金融专业人士在欧洲生活的财务数据集,涵盖2022年1月至2023年12月的1000笔交易。确保收入和支出在各个类别中均衡分布。数据集应包括以下四列:

日期:交易日期(格式:YYYY-MM-DD)
名称/描述:每笔交易的独特详细描述(例如:"工资存款","每月房租支付","与朋友的餐馆晚餐")
支出/收入:明确标明是"支出"还是"收入"
金额(欧元):交易金额(单位:欧元)
生成的数据集包含四列:日期、名称/描述、支出/收入、金额(欧元)。
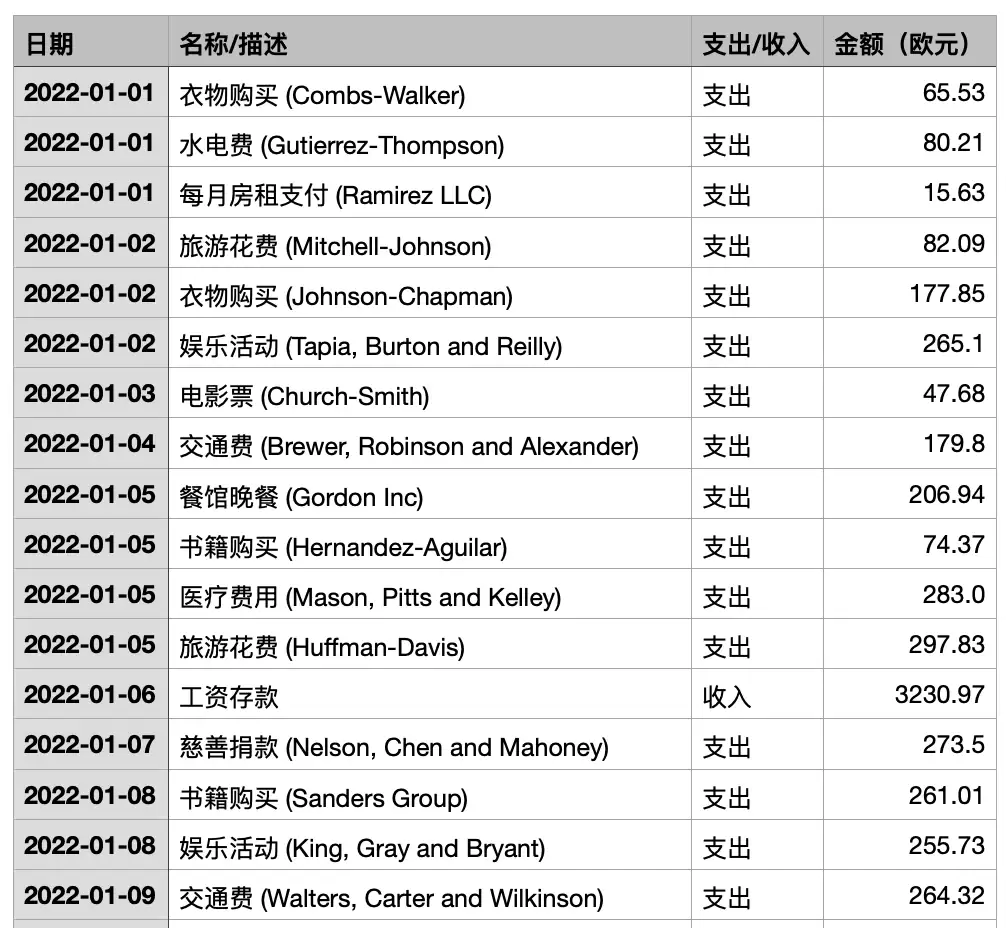
生成的交易数据示例
安装依赖项
现在安装Langchain和Streamlit的相关依赖:
pip install langchain-community
pip install streamlit
Step2:上传并处理数据
上传数据
创建一个新的Python文件“Upload.py”并添加以下代码。
步骤如下:
- 导入必要的库
- 初始化用于分类交易的大模型
- 定义类别:涵盖各种收入和支出类型,帮助大模型准确分类
import streamlit as st
import pandas as pd
from langchain_community.llms import Ollama

llm = Ollama(model="mistral")
categories = [
"Salary/Wages", "Investment Income", "Freelance Income", "Business Revenue","Rental Income",
"Housing", "Utilities","Groceries","Transportation","Insurance","Healthcare","Entertainment",
"Personal Care","Education","Sa vings/Investments","Loans/Debt","Taxes","Childcare",
"Gifts/Donations","Dining Out","Tra vel","Shopping","Subscriptions","Pet Care",
"Home Improvement","Clothing","Tech/Gadgets", "Fitness/Sports",
]
categories_string = ",".join(categories)
构建交易分类函数
1. 分类交易
编写categorize_transactions函数,接收交易名称。通过提示工程引导大模型输出,要求它根据预定义的类别进行分类。收到输出后,将数据组织成结构化的pandas DataFrame。
def categorize_transactions(transaction_names, llm):
    prompt = f"""把以下费用分到适当的类别中。
请记住,类别应从以下列表中选择一个,根据它们的主要目的或性质选择最相关的类别:{categories_string}。
输出格式应始终为:transaction name - category。例如:Spotify #2 - Entertainment, Basic Fit Amsterdam Nld #3 - Fitness/Sports
以下是待分类的交易:{transaction_names}
"""
    print(prompt)
    filtered_response = []
    # retry is the LLM output is not consistent
    while len(filtered_response) < 2:
        response = llm.invoke(prompt).split("n")
        print(response)
        # Remove items that do not contain "transaction: category" pairs
        filtered_response = [item for item in response if '-' in item]
    print(filtered_response)
    # Put in dataframe
    categories_df = pd.DataFrame({"Transaction vs category": filtered_response})
    size_dif = len(categories_df) - len(transaction_names.split(","))
    if size_dif >= 0:
        categories_df["Transaction"] = transaction_names.split(",") + [None] * size_dif
    else:
        categories_df["Transaction"] = transaction_names.split(",")[:len(categories_df)]
    categories_df["Category"] = categories_df["Transaction vs category"].str.split("-", expand=True)[1]
    return categories_df
2. 创建数据处理函数
创建process_data函数,处理上传的数据文件,使用categorize_transactions对交易进行分类,并将分类后的数据合并到全局DataFrame中。
def hop(start, stop, step):
    for i in range(start, stop, step):
        yield i
    yield stop

def process_data(df: pd.DataFrame):
    unique_transactions = df["Name/Description"].unique()
    index_list = list(hop(0, len(unique_transactions), 30))
    # Intialise the categories_df_all dataframe
    categories_df_all = pd.DataFrame()
    # Loop through the index_list
    for i in range(0, len(index_list) - 1):
        print(f"Looping: {i}")
        transaction_names = unique_transactions[index_list[i] : index_list[i + 1]]
        transaction_names = ",".join(transaction_names)
        categories_df = categorize_transactions(transaction_names, llm)
        categories_df_all = pd.concat(
            [categories_df_all, categories_df], ignore_index=True
        )
    # futher clean data:
    # Drop NA values
    categories_df_all = categories_df_all.dropna()
    # Remove the numbering eg "1. " from Transaction column
    categories_df_all["Transaction"] = categories_df_all["Transaction"].str.replace(
        r"d+.s?", "", regex=True
    ).str.strip()
    new_df = pd.merge(
        df,
        categories_df_all,
        left_on="Name/Description",
        right_on="Transaction",
        how="left",
    )
    new_df.to_csv(f"data/{uploaded_file.name}_categorized.csv", index=False)
    return new_df
3. 创建Streamlit Web应用程序
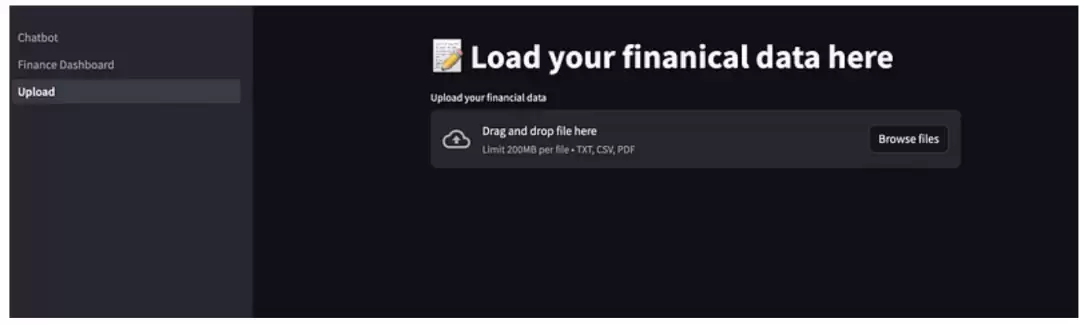
设置应用程序标题,并添加文件上传小部件。
st.title("? Load your financial data here")
uploaded_file = st.file_uploader("Upload your financial data", type=("txt", "csv", "pdf"))
4. 处理上传的数据
文件上传后,读取到pandas DataFrame中,并调用process_data函数进行交易分类。
if uploaded_file:
    with st.spinner("Processing data..."):
        file_details = {"FileName": uploaded_file.name, "FileType": uploaded_file.type}
        df = pd.read_csv(uploaded_file)
        df = process_data(df)
        st.markdown("Data processed : OK")
5. 运行Streamlit应用程序,你将看到一个类似这样的界面。
Step3:财务数据分析
所有交易都通过Mistral分类后,就可以进行财务分析了。包括三个步骤:
- :计算收入和支出,确定资金的主要流向。
定量分析
- :绘制图表,发现趋势。
可视化展示
- :将主要财务指标(包括图表)反馈给Mistral,让大模型给出定性分析。
定性分析
定量分析
创建一个新的Python文件“Finance_Dashboard.py”,导入必要的库并初始化Ollama。
import os
import streamlit as st
import pandas as pd
import matplotlib.pyplot as plt
from langchain_community.llms import Ollama

llm_lla va = Ollama(model="lla va")
llm = Ollama(model="mistral")
然后,创建financial_analysis函数来分析财务数据。
def financial_analysis(data:pd.DataFrame):
    key_figures = {}
    # Calculate yearly total income and total expenses
    yearly_income = data.loc[data['Expense/Income'] == 'Income'].groupby('Year')['Amount(EUR)'].sum().mean()
    yearly_expenses = data.loc[data['Expense/Income'] == 'Expense'].groupby('Year')['Amount(EUR)'].sum().mean()
    # Identify the top expense categories
    top_expenses = data.loc[data['Expense/Income'] == 'Expense'].groupby('Category')['Amount(EUR)'].sum().sort_values(ascending=False)
    # Calculate a verage monthly income and expenses
    monthly_income = data.loc[data['Expense/Income'] == 'Income'].groupby(data['Date'].dt.to_period('M'))['Amount(EUR)'].sum().mean()
    monthly_expenses = data.loc[data['Expense/Income'] == 'Expense'].groupby(data['Date'].dt.to_period('M'))['Amount(EUR)'].sum().mean()
    # Determine the sa vings rate
    sa vings = yearly_income - yearly_expenses
    sa vings_rate = (sa vings / yearly_income) * 100 if yearly_income > 0 else 0
    key_figures['A verage Annual Income'] = f"€{yearly_income:,.2f}"
    key_figures['A verage Annual Expenses'] = f"€{yearly_expenses:,.2f}"
    key_figures['Annual Sa vings Rate'] = f" {sa vings_rate:.2f}%"
    key_figures['Top Expense Categories'] = {category: f"€{amount:,.2f}" for category, amount in top_expenses.head().items()}
    key_figures['A verage Monthly Income'] = f"€{monthly_income:,.2f}"
    key_figures['A verage Monthly Expenses'] = f"€{monthly_expenses:,.2f}"
    return key_figures
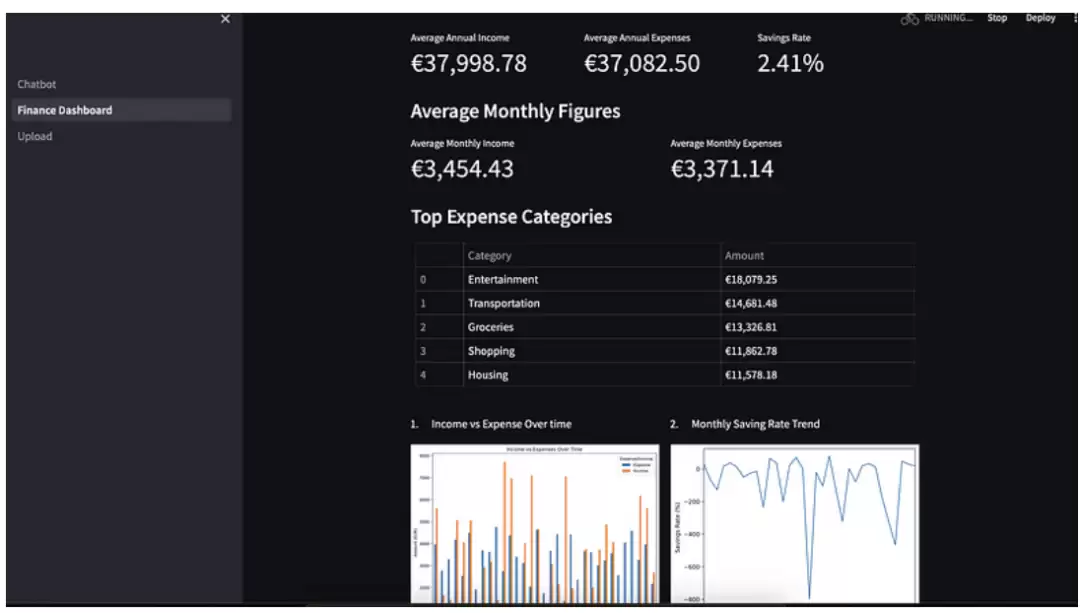
这个函数计算年度和月度的收入与支出、储蓄率,并识别主要支出类别。
可视化展示
可视化部分包括收入与支出随时间变化、每月存款、收入来源、支出类别等图表。
def plot_income_vs_expense_over_time(df):
    # Income vs Expense Over time
    st.markdown("1. Income vs Expense Over time")
    income_expense_summary = (
        df.groupby(["YearMonth", "Expense/Income"])["Amount(EUR)"]
        .sum()
        .unstack()
        .fillna(0)
    )
    income_expense_summary.plot(kind="bar", figsize=(10, 8))
    plt.title("Income vs Expenses Over Time")
    plt.ylabel("Amount (EUR)")
    plt.xlabel("Month")
    plt.sa vefig("data/income_vs_expense_over_time.png", bbox_inches="tight")
    st.pyplot(plt)

def plot_sa ving_rate_trend(data: pd.DataFrame):
    st.markdown("2. Monthly Sa ving Rate Trend")
    monthly_data = data.groupby(['YearMonth', 'Expense/Income'])['Amount(EUR)'].sum().unstack().fillna(0)
    monthly_data['Sa vings Rate'] = (monthly_data['Income'] - monthly_data['Expense']) / monthly_data['Income'] * 100
    fig, ax = plt.subplots()
    monthly_data['Sa vings Rate'].plot(ax=ax)
    ax.set_xlabel('Month')
    ax.set_ylabel('Sa vings Rate (%)')
    plt.sa vefig("data/sa ving_rate_over_time.png", bbox_inches="tight")
    st.pyplot(fig)

def plot_income_source_analysis(data: pd.DataFrame):
    st.markdown("3. Income Sources Analysis")
    income_sources = data[data['Expense/Income'] == 'Income'].groupby('Category')['Amount(EUR)'].sum()
    income_sources.plot(kind="pie", figsize=(10, 8), autopct="%1.1f%%", startangle=140)
    plt.title("Income Sources Analysis")
    plt.ylabel("")
    plt.sa vefig("data/income_source_analysis.png", bbox_inches="tight")
    st.pyplot(plt)

def plot_category_wise_spending_analysis(data: pd.DataFrame):
    st.markdown("4. Category-wise Spending Analysis")
    expenses_by_category = data[data['Expense/Income'] == 'Expense'].groupby('Category')['Amount(EUR)'].sum()
    expenses_by_category.plot(kind="pie", figsize=(10, 8), autopct="%1.1f%%", startangle=140)
    plt.title("Expenses Analysis")
    plt.ylabel("")
    plt.sa vefig("data/expense_category_analysis.png", bbox_inches="tight")
    st.pyplot(plt)
加载财务数据:
total_df = pd.DataFrame()
for root, dirs, files in os.walk("data"):
    for file in files:
        if file.endswith(".csv"):
            df = pd.read_csv(os.path.join(root, file))
            total_df = pd.concat([total_df, df], ignore_index=True)

total_df["Date"] = pd.to_datetime(total_df["Date"])
total_df["YearMonth"] = total_df["Date"].dt.to_period("M")
total_df["Year"] = total_df["Date"].dt.year
设置Streamlit仪表盘:
st.title("My Local AI Finance Insighter")
st.markdown(
    "**A personalized and secure approach to analyzing financial data, providing insights and recommendations tailored to individual needs.**"
)

analysis_results = financial_analysis(total_df)
results_str = ""
# Loop through the dictionary
for key, value in analysis_results.items():
    if isinstance(value, dict):
        sub_results = ', '.join([f"{sub_key}: {sub_value}" for sub_key, sub_value in value.items()])
        results_str += f"{key}: {sub_results}\n"
    else:
        results_str += f"{key}: {value}\n"

st.subheader("Yearly Figures")
col1, col2, col3 = st.columns(3)
col1.metric(label="A verage Annual Income", value=analysis_results['A verage Annual Income'])
col2.metric(label="A verage Annual Expenses", value=analysis_results['A verage Annual Expenses'])
col3.metric(label="Sa vings Rate", value=analysis_results['Annual Sa vings Rate'])

st.subheader("A verage Monthly Figures")
col1, col2 = st.columns(2)
col1.metric(label="A verage Monthly Income", value=analysis_results['A verage Monthly Income'])
col2.metric(label="A verage Monthly Expenses", value=analysis_results['A verage Monthly Expenses'])

st.subheader("Top Expense Categories")
expenses_df = pd.DataFrame(list(analysis_results['Top Expense Categories'].items()), columns=['Category', 'Amount'])
st.table(expenses_df)

with st.container():
    col1, col2 = st.columns(2)
    with col1:
        plot_income_vs_expense_over_time(total_df)
    with col2:
        plot_sa ving_rate_trend(total_df)

with st.container():
    col3, col4 = st.columns(2)
    with col3:
        plot_income_source_analysis(total_df)
    with col4:
        plot_category_wise_spending_analysis(total_df)
运行Streamlit后,你会看到一个类似这样的仪表盘:
Step4:提供财务建议
最后,把定量和定性分析结果喂给Mistral,生成个性化财务建议!
with st.container():
    col3, col4 = st.columns(2)
    with col3:
        plot_income_source_analysis(total_df)
    with col4:
        plot_category_wise_spending_analysis(total_df)

with st.spinner("Generating reports ..."):
    total_response = ""
    for root, dirs, files in os.walk("data"):
        for file in files:
            if file.endswith(".png"):
                response = llm_lla va.invoke(
                    f"Act as an expert finance planner and analyse the image : {os.path.join(root, file)}. You should give your insights extracted from the image and key figures you see from the image "
                )
                total_response += response
    total_response += f"\nHere are the user key financial figures : {results_str}"

    st.write("---------------")
    st.markdown("**Finance analysis and budget planner**")

    summary = llm.invoke(
        f"You are a helpful and expert finance planner. Base on the following analysis: {total_response}, make a summary of the financial status of the user and suggest tips on sa vings. Highlight categories where the user can potentially reduce expenses and suggest an ideal sa vings rate based on their income and goals. Tailor these suggestions to fit the user’s lifestyle and financial objectives. Use a friendly tone. "
    )
    st.write(summary)
    st.write("---------------")
    st.markdown("**Investment tips**")
    if "user_answers_str" in st.session_state:
        user_investment_answer = st.session_state.user_answers_str
    else:
        user_investment_answer = ""
    investment_tips = llm.invoke(
        f"You are a helpful and expert finance planner. Based on the user's risk tolerance and investment goals, provide an overview of suitable investment options. Discuss the basics of stocks, bonds, mutual funds, ETFs, and other investment vehicles that align with their profile. Explain the importance of diversification and the role of risk management in investing. Offer to guide them through setting up a diversified investment portfolio, suggesting steps to get started based on their current financial situation. Use a friendly tone. Below are the user´s investment objective and risk tolerance : {user_investment_answer}"
    )
    st.write(investment_tips)
生成的报告结构完整,不过篇幅可能偏长。可以进一步优化提示词以获得更简洁的输出。

结 语
以上就是本地AI驱动的财务洞察工具的全貌——它能帮你更好地了解自己的财务状况。借助生成式AI的力量,为每个人量身定制高度个性化的建议。更关键的是,你的财务数据始终安全地保存在自己的电脑上,绝不会泄露给任何第三方。
希望这个项目能给你带来启发!
-

- 关于宇宙的好的网名有哪些
- 角色扮演 | 1
- 网名