
使用 LangChain 从文本数据构建知识图
大脑天生擅长用“信息图”的方式存储知识——节点与连线,简单又直观。知识图谱正是模仿这种结构,把实体和关系装进一张动态网络里。这篇文章就带你拆解知识图谱的核心概念,并手把手教你从零开始,用自己的文本搭建一个可交互的知识图谱。
什么是知识图谱?
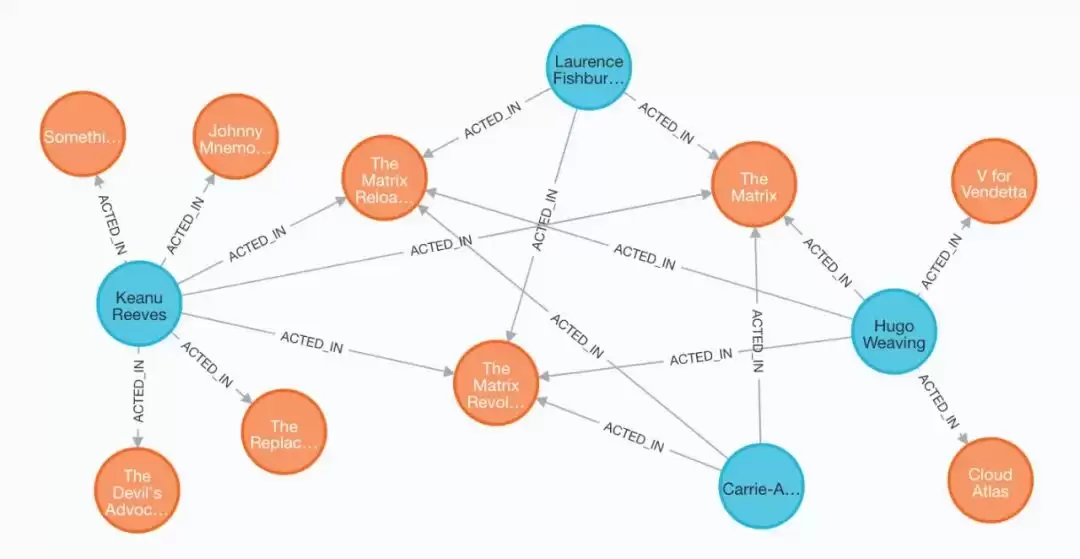
Knowledge Graph,也叫语义图,是一种高效的数据存储框架。数据以“节点”和“边”的形式存在:节点代表事物,边代表事物之间的关系。这种模型在学术圈常被称为资源描述框架(RDF),它定义了万维网上站点之间如何互联互通。简单说,知识图谱就是把散落的信息点连成一张有意义的网。
为什么需要知识图谱?
大数据里真正关键的连接点其实不多。知识图谱只保留那些最有代表性的实体和关系,从而大幅降低检索时间复杂度和空间复杂度。打个比方:它就像一本精心整理的电话本,而不是一本杂乱无章的通讯录。
一个典型的应用场景是药物发现——从海量文献中抽取化合物与靶点的关系,或者构建基于RAG(检索增强生成)的智能客服机器人,让机器不仅能回答问题,还能理解答案背后的逻辑链路。
实施
1、安装和导入软件包
(注意:我们需要用到Open AI的GPT-3.5来生成实体和关系,记得准备好自己的Open AI API密钥。)
使用你喜欢的包管理器安装依赖。这里用PIP来安装和管理:
pip install -q langchain openai pyvis gradio==3.39.0
然后导入这些包:
from langchain.prompts import PromptTemplate
from langchain.llms.openai import OpenAI
from langchain.chains import LLMChain
from langchain.graphs.networkx_graph import KG_TRIPLE_DELIMITER
from pprint import pprint
from pyvis.network import Network
import networkx as nx
import gradio as gr
2、设置API密钥
从Open AI平台复制API密钥,设置环境变量。这里通过Colab的secrets传递变量,运行前要确保已经分配好秘密变量:
from google.colab import userdata
OPENAI_API_KEY = userdata.get('OPENAI_API_KEY')
3、定义提示
向大模型提问是个技术活——问题越精准,答案越靠谱。这里采用Few-Shot(少样本)提示方式,给模型几个示例,告诉它抽取出什么格式的三元组,同时减少幻觉。下面这个模板值得仔细读一读:
# 用于知识三元组提取的提示模板
_DEFAULT_KNOWLEDGE_TRIPLE_EXTRACTION_TEMPLATE = (
    "You are a networked intelligence helping a human track knowledge triples"
    " about all relevant people, things, concepts, etc. and integrating"
    " them with your knowledge stored within your weights"
    " as well as that stored in a knowledge graph."
    " Extract all of the knowledge triples from the text."
    " A knowledge triple is a clause that contains a subject, a predicate,"
    " and an object. The subject is the entity being described,"
    " the predicate is the property of the subject that is being"
    " described, and the object is the value of the property.\n\n"
    "EXAMPLE\n"
    "It's a state in the US. It's also the number 1 producer of gold in the US.\n\n"
    f"Output: (Nevada, is a, state){KG_TRIPLE_DELIMITER}(Nevada, is in, US)"
    f"{KG_TRIPLE_DELIMITER}(Nevada, is the number 1 producer of, gold)\n"
    "END OF EXAMPLE\n\n"
    "EXAMPLE\n"
    "I'm going to the store.\n\n"
    "Output: NONE\n"
    "END OF EXAMPLE\n\n"
    "EXAMPLE\n"
    "Oh huh. I know Descartes likes to drive antique scooters and play the mandolin.\n"
    f"Output: (Descartes, likes to drive, antique scooters){KG_TRIPLE_DELIMITER}(Descartes, plays, mandolin)\n"
    "END OF EXAMPLE\n\n"
    "EXAMPLE\n"
    "{text}"
    "Output:"
)

KNOWLEDGE_TRIPLE_EXTRACTION_PROMPT = PromptTemplate(
    input_variables=["text"],
    template=_DEFAULT_KNOWLEDGE_TRIPLE_EXTRACTION_TEMPLATE,
)
4、初始化链
有了提示,还得把模型和提示绑在一起。用LLMChain类创建一条处理链:
llm = OpenAI(
    api_key=OPENAI_API_KEY,
    temperature=0.9
)

# 使用知识三元组提取提示创建一个LLMChain
chain = LLMChain(llm=llm, prompt=KNOWLEDGE_TRIPLE_EXTRACTION_TEMPLATE)
构造知识图谱只需要一段相关的文本。这里直接用字符串输入,但实际项目中可以从PDF、JSON、Markdown等格式加载(参考LangChain的数据加载器[3])。试试看:
# 运行链,传入文本
text = "The city of Paris is the capital and most populous city of France. The Eiffel Tower is a famous landmark in Paris."
triples = chain.invoke({'text' : text}).get('text')
再写个函数解析返回的三元组:
def parse_triples(response, delimiter=KG_TRIPLE_DELIMITER):
    if not response:
        return []
    return response.split(delimiter)

triples_list = parse_triples(triples)
pprint(triples_list)
输出:
[' (Paris, is the capital of, France)',
 '(Paris, is the most populous city in, France)',
 '(Eiffel Tower, is a, famous landmark)',
 '(Eiffel Tower, is in, Paris)']
5、可视化构建的知识图谱
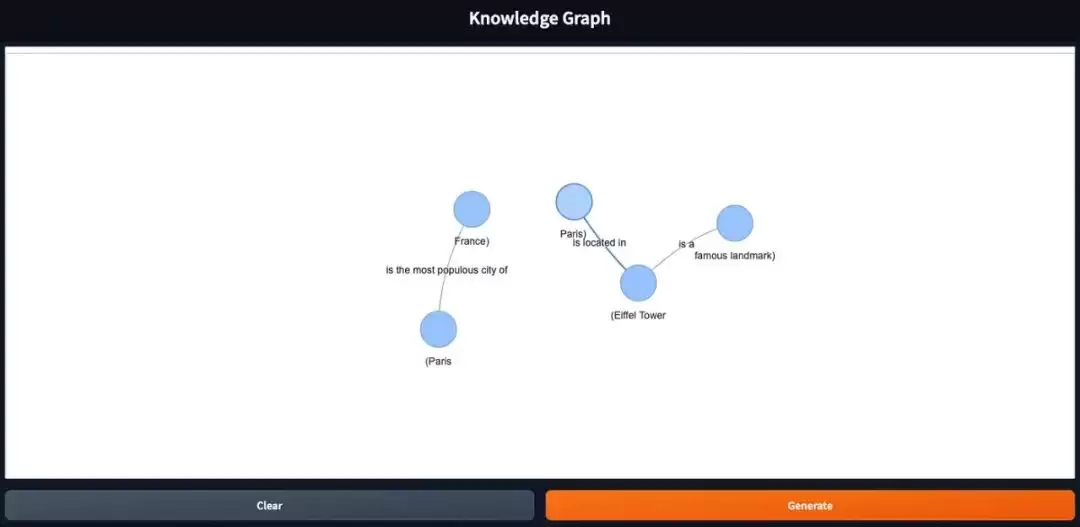
数据有了,接下来让它“长”出图来。用PyVis生成交互式可视化,再通过Gradio框架嵌入到网页中。下面几个辅助函数搞定一切:
def create_graph_from_triplets(triplets):
    G = nx.DiGraph()
    for triplet in triplets:
        subject, predicate, obj = triplet.strip().split(',')
        G.add_edge(subject.strip(), obj.strip(), label=predicate.strip())
    return G

def nx_to_pyvis(networkx_graph):
    pyvis_graph = Network(notebook=True, cdn_resources='remote')
    for node in networkx_graph.nodes():
        pyvis_graph.add_node(node)
    for edge in networkx_graph.edges(data=True):
        pyvis_graph.add_edge(edge[0], edge[1], label=edge[2]["label"])
    return pyvis_graph

def generateGraph():
    triplets = [t.strip() for t in triples_list if t.strip()]
    graph = create_graph_from_triplets(triplets)
    pyvis_network = nx_to_pyvis(graph)

    pyvis_network.toggle_hide_edges_on_drag(True)
    pyvis_network.toggle_physics(False)
    pyvis_network.set_edge_smooth('discrete')

    html = pyvis_network.generate_html()
    html = html.replace("'", "\"")

    return f"""<iframe name="result" allow="midi; geolocation; microphone; camera;
display-capture; encrypted-media;" sandbox="allow-modals allow-forms
allow-scripts allow-same-origin allow-popups
allow-top-na vigation-by-user-activation allow-downloads" allowfullscreen=""
allowpaymentrequest="" frameborder="0" srcdoc='{html}'></iframe>"""
最后用Gradio启动一个简易界面:
demo = gr.Interface(
    generateGraph,
    inputs= None,
    outputs=gr.outputs.HTML(),
    title="知识图谱",
    allow_flagging= 'never',
    live= True,
)

demo.launch(
    height= 800,
    width= "100%"
)
最终输出:通过Gradle框架展示知识图,还能一键生成分享链接。只要在`demo.launch(share=True)`里加个参数,任何人都能在线查看这个交互式图谱。
-

- 关于宇宙的好的网名有哪些
- 角色扮演 | 1
- 网名